You're Looking at a Breakup. In Data Format
2013.12.03

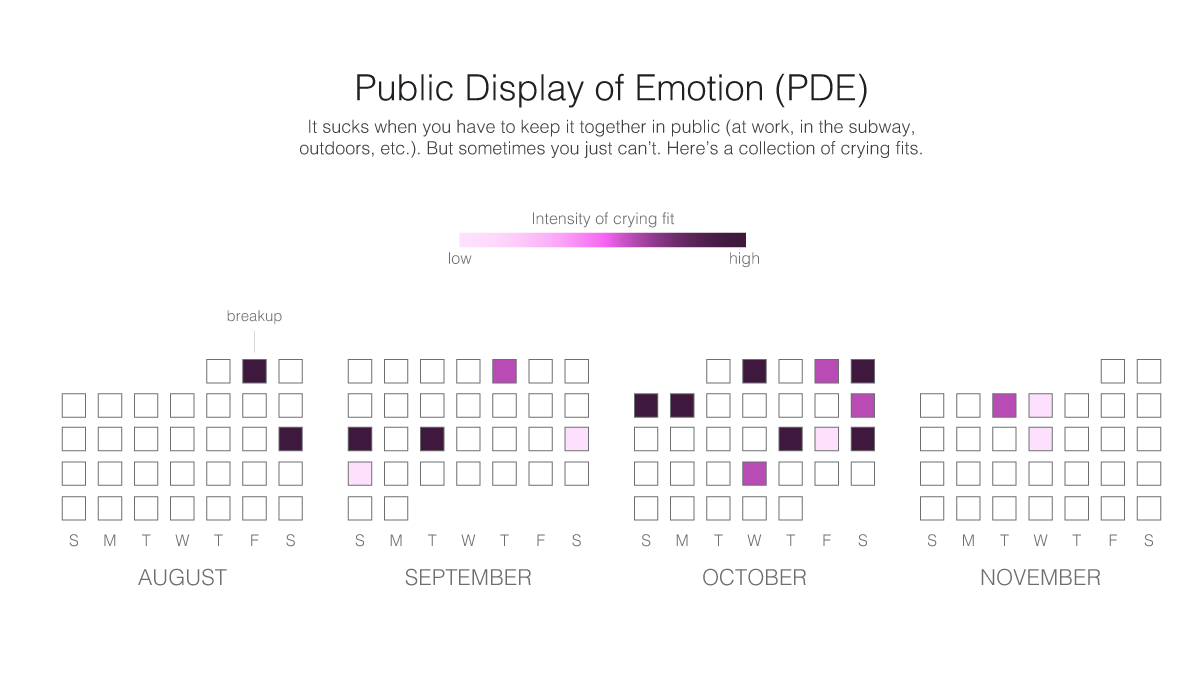
Breaking up is a hard thing to do. It may also be a hard thing to watch, in data that is. So much agony! Studying all that data helped one woman get through that tough emotional time.
Quantified Breakup mashes up the personal data of the woman in question and shows her emails, chats, phone logs, bank statements, and GPS traces to help her cope with the life change. She explains:
Divorce is hard. Putting this process into numbers, images and data visualizations is helpful. It yanks me out of these all-consuming moments of sadness and helps me understand how, perhaps as time passes, things are going to be ok in the long run (looking for positive trends within the data!) I hope these web things can help you, too.
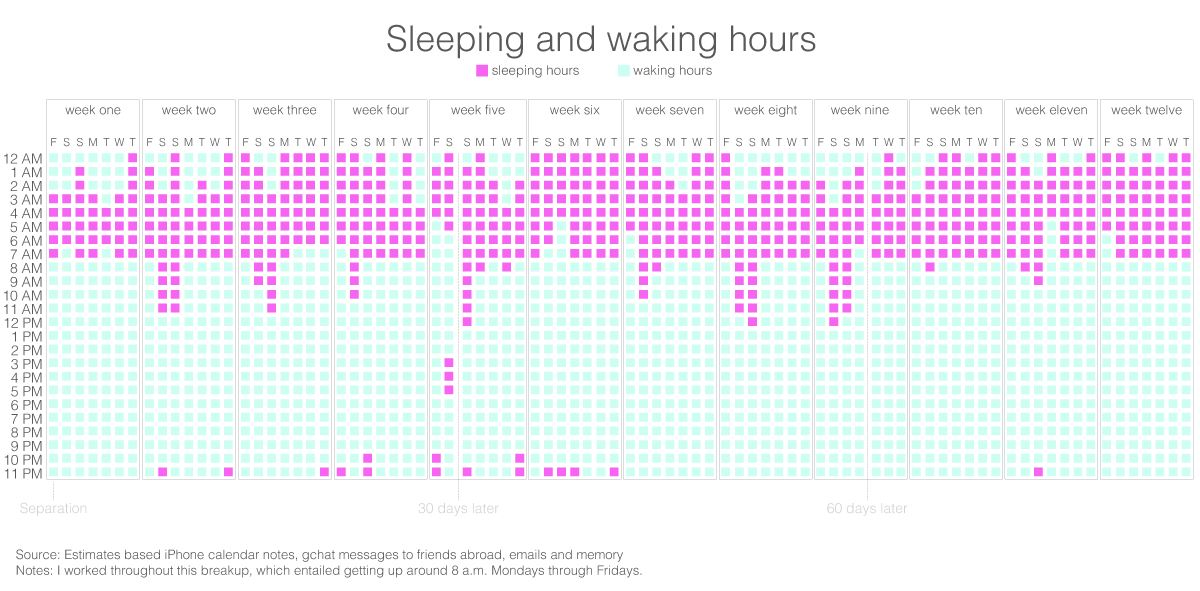
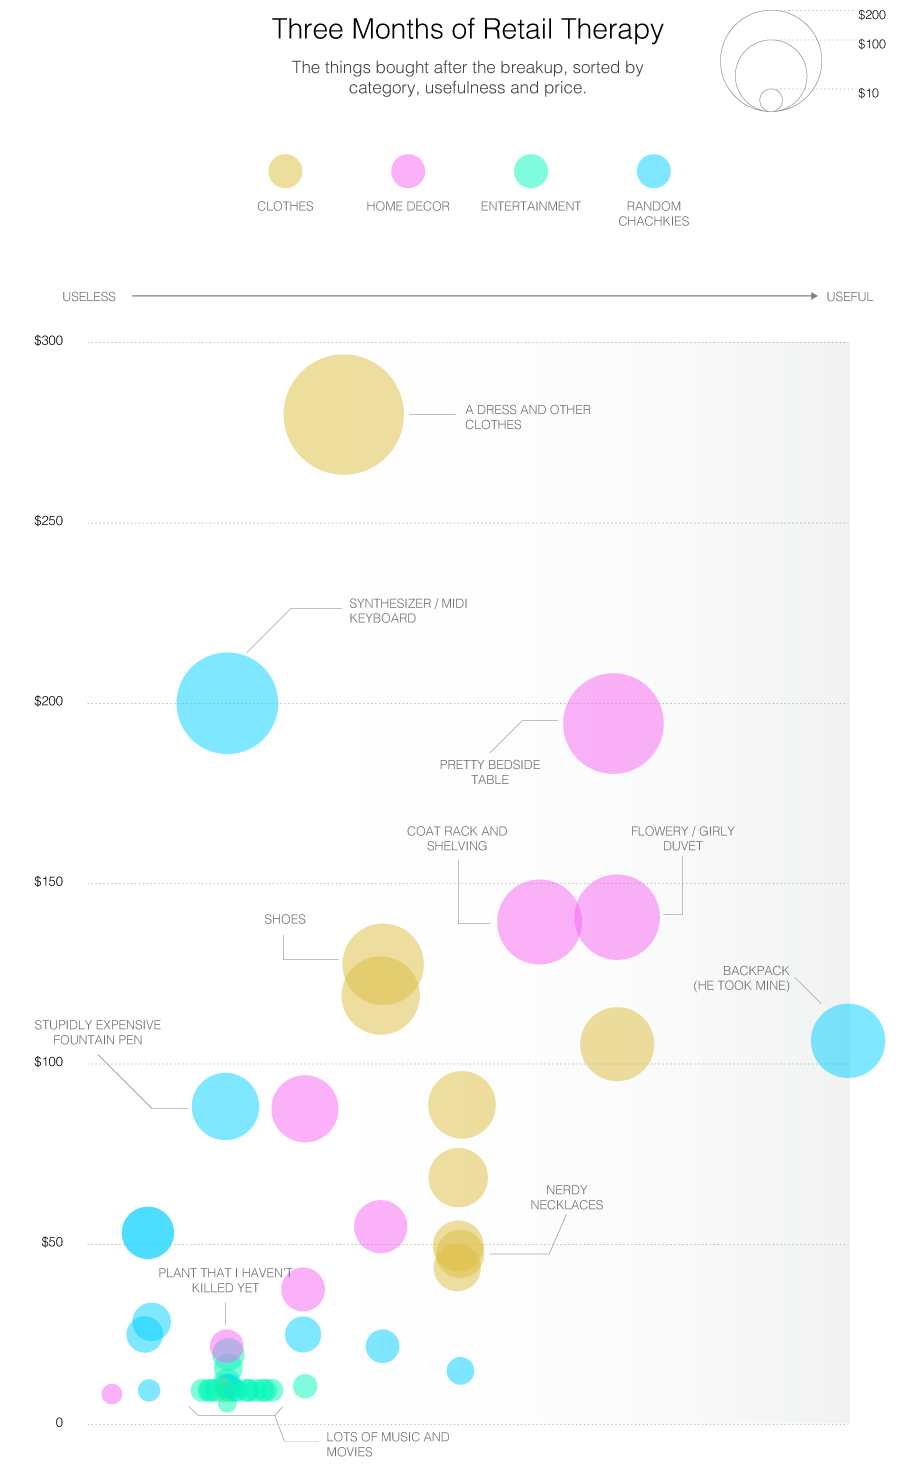
Here are a few things you'll see at the blog:Recording Changing Sleep Patterns

Mapping Cathartic Exercise Sessions

Visualizing Retail Therapy

Check out more over at Quantified Breakup for an insight into how looking at that kind of data could help distract you, and perhaps, possibly help you move on. [Quantified Breakup via Flowing Data]
More Articles
Copyright © Fooyoh.com All rights reserved.