 Fat or Fiction Gives You a Visual Guide to Food's Nutritional Content

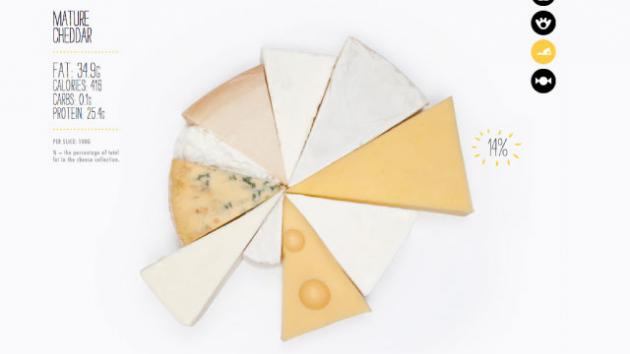
It's not as simple as it is to figure out the fat and calorie content of different foods, but this chart here makes it easier. Called Fat or Fiction, it places food servings next to each other in stunning photographs.
When you roll over the infotography images, you will get the nutritional details of the various foods, and a percent of total fat it makes in the whole collection.
Take the cheese pie above, the giant slice of it is 14% of the whole, and the small blue dots on it is also 14% in total as is the medium-sized cream cheese below the mature cheddar.
There are a few different types of snacks and drinks visualized here: cakes, alcoholic drinks, candy bars, chips and crackers, and various candies.
Check it out over at their site in the source links below:
Fat or Fiction | via FlowingData


